- News |
-
- Featured
-
Canada’s privacy commissioner launches investigation over the use..
As the years pass by, technology also widens, and more and more are being discovered. From simple gadgets..
- Business |
-
- Featured
-
Be an informer to I-T dept; earn up..
Sharing "specific information" with the income tax department about any benami..

- Tech & Industry |
-
- Featured
-
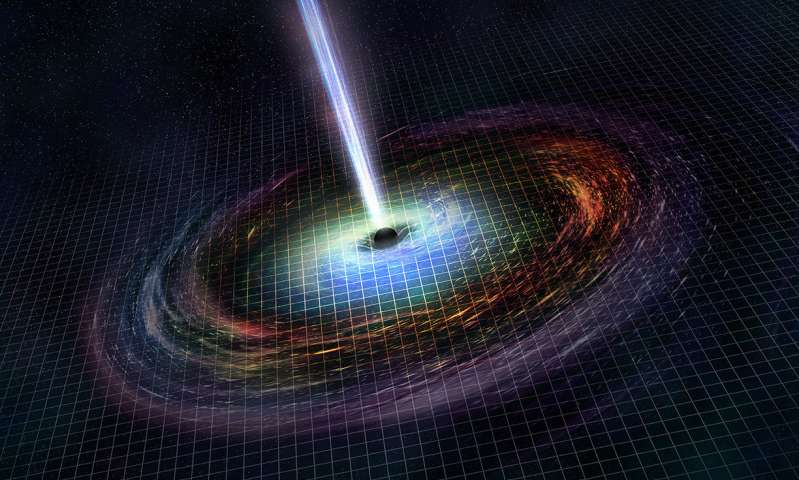
Gravitational wave event likely signaled birth of black..
The merger of two neutron stars that generated gravitational waves detected last year may have led to the birth..
- Entertainment |
-
- Topics
- Malayalam Film
- Media
- Music
- Youth
-
- Featured
-
Shawn Mendes Released Highly Anticipated Self-Titled Album Today
Los Angeles, CA : Multi-Platinum singer/songwriter Shawn Mendes released his highly anticipated self-titled third album today, via Island Records. Get..

-
- New Products |
-
- Topics
- General
-
- Featured
-
ZOTAC Introduces Its GeForce GTX 960 series graphics..
Dubai- ZOTAC International, a leading innovator and manufacturer of graphic cards and mini-

-
- Education |
-
- Topics
- Campus News
-
- Featured
-
ITM University, Gurgaon Student Palash Chhabra Represents Varsity..
New Delhi: Palash Chhabra, a student of ITM University,..

-
- Health |
-
- Topics
- Medical News
-
- Featured
-
Maharshi Shushruta, The Great Grandfather of Surgery!
by Ayurvedacharya Dr.Hitesh Jani Dr.Hitesh Jani

-
- Tourism |
-
- Topics
- Travel
- Food&Beverages
- Hospitality
-
- Featured
-
“Keraliya Ayurveda is Credible and Authentic”
Irina Gurjeva Irina Gurjeva is not just another vacationer in..

-
- Sports |
- Editor's column |
- Magazine |
Index Numbers of Wholesale Price in India (Base: 2004-05=100) Review for the month of June, 2016
FINAL INDEX FOR THE MONTH OF APRIL, 2016 (BASE YEAR: 2004-05=100)
Published on July 14, 2016
New Delhi; For the month of April, 2016, the final Wholesale Price Index for ‘All Commodities’ (Base: 2004-05=100) stood at 177.8 as compared to 177.0 (provisional) and annual rate of inflation based on final index stood at 0.79 percent as compared to 0.34 percent (provisional) respectively as reported on 16.05.2016.
Annexure-I
Wholesale Price Index and Rates of Inflation (Base Year: 2004-05=100)
|
Month of June, 2016 |
|||||||||
| Commodities/Major Groups/Groups/Sub-Groups |
Weight |
WPI June- 2016 |
Latest month over month |
Build up from March |
Year on year |
||||
|
2015-16 |
2016-17 |
2015-16 |
2016-17 |
2015-16 |
2016-17 |
||||
| ALL COMMODITIES |
100.00000 |
182.0 |
0.62 |
1.45 |
1.70 |
3.82 |
-2.13 |
1.62 |
|
| PRIMARY ARTICLES |
20.11815 |
262.8 |
2.01 |
2.94 |
4.23 |
6.79 |
-0.48 |
5.50 |
|
| Food Articles |
14.33709 |
279.0 |
2.63 |
2.91 |
3.45 |
7.51 |
3.12 |
8.18 |
|
| Cereals |
3.37323 |
245.6 |
0.22 |
1.87 |
-0.04 |
1.78 |
-0.39 |
6.32 |
|
| Rice |
1.79348 |
245.2 |
1.19 |
2.34 |
1.54 |
2.72 |
-1.62 |
3.37 |
|
| Wheat |
1.11595 |
225.2 |
-1.08 |
1.76 |
-2.18 |
-1.31 |
1.84 |
6.83 |
|
| Pulses |
0.71662 |
400.2 |
11.07 |
3.73 |
22.61 |
15.50 |
36.78 |
26.61 |
|
| Vegetables |
1.73553 |
297.3 |
13.12 |
17.09 |
17.30 |
39.97 |
-6.82 |
16.91 |
|
| Potato |
0.20150 |
248.7 |
8.54 |
11.57 |
0.00 |
54.38 |
-51.60 |
64.48 |
|
| Onion |
0.17794 |
255.4 |
12.98 |
3.03 |
7.58 |
-6.65 |
19.07 |
-28.60 |
|
| Fruits |
2.10717 |
260.9 |
-1.64 |
0.42 |
0.98 |
9.85 |
7.60 |
5.97 |
|
| Milk |
3.23818 |
258.0 |
0.08 |
0.94 |
1.05 |
1.61 |
5.18 |
3.24 |
|
| Egg, Meat & Fish |
2.41384 |
305.4 |
3.02 |
0.13 |
-1.31 |
1.53 |
-2.25 |
6.67 |
|
| Non-Food Articles |
4.25756 |
231.2 |
0.92 |
2.12 |
7.95 |
5.19 |
1.16 |
5.72 |
|
| Fibres |
0.87737 |
238.8 |
0.05 |
8.25 |
8.07 |
14.31 |
-11.63 |
14.26 |
|
| Oil Seeds |
1.78051 |
224.1 |
1.11 |
0.90 |
6.95 |
5.91 |
3.06 |
2.52 |
|
| Minerals |
1.52350 |
199.0 |
-1.26 |
6.87 |
3.21 |
3.16 |
-27.64 |
-20.75 |
|
| FUEL & POWER |
14.91021 |
186.5 |
0.73 |
3.44 |
2.93 |
8.18 |
-8.86 |
-3.62 |
|
| Liquefied petroleum gas |
0.91468 |
161.2 |
-0.31 |
0.56 |
0.06 |
0.69 |
-4.85 |
-0.98 |
|
| Petrol |
1.09015 |
166.0 |
2.36 |
4.80 |
10.18 |
11.56 |
-7.10 |
-8.74 |
|
| High speed diesel |
4.67020 |
214.4 |
1.15 |
7.68 |
4.33 |
16.97 |
-9.86 |
1.13 |
|
| MANUFACTURED PRODUCTS |
64.97164 |
156.0 |
-0.06 |
0.19 |
0.19 |
1.23 |
-0.77 |
1.17 |
|
| Food Products |
9.97396 |
186.9 |
0.12 |
0.86 |
1.41 |
4.06 |
-0.46 |
8.35 |
|
| Sugar |
1.73731 |
207.8 |
-2.25 |
0.78 |
-5.56 |
9.20 |
-13.26 |
26.09 |
|
| Edible Oils |
3.04293 |
154.3 |
1.43 |
1.25 |
3.04 |
3.07 |
2.83 |
3.42 |
|
| Beverages, Tobacco & Tobacco Product |
1.76247 |
220.7 |
0.05 |
0.78 |
1.38 |
4.20 |
3.99 |
7.14 |
|
| Cotton Textiles |
2.60526 |
158.5 |
0.38 |
0.57 |
0.76 |
1.73 |
-4.96 |
-0.25 |
|
| Man Made Textiles |
2.20573 |
128.4 |
-0.07 |
-0.31 |
0.98 |
-0.54 |
-1.03 |
-4.11 |
|
| Wood & Wood Products |
0.58744 |
196.6 |
0.10 |
-0.20 |
3.69 |
-0.20 |
5.24 |
-0.05 |
|
| Paper & Paper Products |
2.03350 |
155.9 |
0.00 |
0.32 |
0.26 |
0.06 |
2.54 |
1.70 |
|
| Leather & Leather Products |
0.83509 |
145.5 |
0.21 |
-0.14 |
1.48 |
-0.21 |
-0.96 |
0.76 |
|
| Rubber & Plastic Products |
2.98697 |
146.1 |
0.34 |
0.07 |
0.88 |
0.55 |
-0.33 |
-2.34 |
|
| Chemicals & Chemical Products |
12.01770 |
150.9 |
0.13 |
0.53 |
0.40 |
0.87 |
-1.17 |
-0.40 |
|
| Non-Metallic Mineral Products |
2.55597 |
177.7 |
0.40 |
-0.56 |
-1.06 |
-0.39 |
4.62 |
0.51 |
|
| Cement & Lime |
1.38646 |
174.8 |
0.81 |
-0.34 |
-2.25 |
-0.51 |
4.95 |
0.63 |
|
| Basic Metals Alloys & Metal Product |
10.74785 |
153.9 |
-0.94 |
-0.65 |
-1.98 |
0.33 |
-4.91 |
-3.02 |
|
| Iron & Semis |
1.56301 |
135.5 |
-1.42 |
-1.95 |
-2.15 |
-0.59 |
-9.67 |
-7.00 |
|
| Machinery & Machine Tools |
8.93148 |
135.3 |
0.15 |
-0.15 |
0.15 |
0.15 |
0.52 |
0.07 |
|
| Transport Equipment & Parts |
5.21282 |
139.4 |
0.00 |
0.07 |
0.29 |
0.29 |
1.18 |
1.23 |
|
Annexure-II |
|||||||
|
|
|||||||
|
Trend of Rate of Inflation for some important items during last six months |
|||||||
|
|
|||||||
|
Commodities/Major Groups/Groups/Sub-Groups |
Weight (%) |
Rate of Inflation for the last six months |
|||||
|
June-16 |
May-16 |
Apr-16 |
Mar-16 |
Feb-16 |
Jan-16 |
||
| ALL COMMODITIES |
100.00 |
1.62 |
0.79 |
0.79 |
-0.45 |
-0.85 |
-1.07 |
| PRIMARY ARTICLES |
20.12 |
5.50 |
4.55 |
3.41 |
2.97 |
2.03 |
4.30 |
| Food Articles |
14.34 |
8.18 |
7.88 |
4.70 |
4.09 |
3.91 |
6.46 |
| Cereals |
3.37 |
6.32 |
4.60 |
4.24 |
4.41 |
3.30 |
2.91 |
| Rice |
1.79 |
3.37 |
2.22 |
1.75 |
2.18 |
-0.08 |
-0.13 |
| Wheat |
1.12 |
6.83 |
3.85 |
5.00 |
5.89 |
6.03 |
5.54 |
| Pulses |
0.72 |
26.61 |
35.56 |
36.55 |
34.41 |
38.37 |
45.03 |
| Vegetables |
1.74 |
16.91 |
12.94 |
2.90 |
-2.03 |
-2.94 |
12.71 |
| Potato |
0.20 |
64.48 |
60.01 |
40.84 |
6.55 |
-7.39 |
-17.08 |
| Onion |
0.18 |
-28.60 |
-21.70 |
-17.89 |
-17.71 |
-10.20 |
7.45 |
| Fruits |
2.11 |
5.97 |
3.80 |
-1.81 |
-2.58 |
-1.66 |
-2.03 |
| Milk |
3.24 |
3.24 |
2.36 |
2.83 |
2.67 |
1.74 |
1.42 |
| Egg, Meat & Fish |
2.41 |
6.67 |
9.75 |
3.27 |
3.69 |
3.40 |
5.90 |
| Non-Food Articles |
4.26 |
5.72 |
4.48 |
7.26 |
8.49 |
7.09 |
9.35 |
| Fibres |
0.88 |
14.26 |
5.60 |
5.17 |
8.01 |
10.17 |
7.97 |
| Oil Seeds |
1.78 |
2.52 |
2.73 |
6.07 |
3.52 |
3.46 |
5.76 |
| Minerals |
1.52 |
-20.75 |
-26.78 |
-18.69 |
-20.72 |
-27.65 |
-29.27 |
| FUEL & POWER |
14.91 |
-3.62 |
-6.14 |
-4.83 |
-8.30 |
-7.06 |
-9.89 |
| Liquefied petroleum gas |
0.91 |
-0.98 |
-1.84 |
-1.84 |
-1.60 |
-0.37 |
-1.26 |
| Petrol |
1.09 |
-8.74 |
-10.86 |
-4.18 |
-9.87 |
-1.03 |
-5.45 |
| High speed diesel |
4.67 |
1.13 |
-5.01 |
-3.94 |
-9.79 |
-7.75 |
-13.00 |
| MANUFACTURED PRODUCTS |
64.97 |
1.17 |
0.91 |
1.04 |
0.13 |
-0.52 |
-1.17 |
| Food Products |
9.97 |
8.35 |
7.54 |
8.72 |
5.58 |
4.34 |
2.79 |
| Sugar |
1.74 |
26.09 |
22.30 |
17.34 |
9.05 |
5.23 |
-0.55 |
| Edible Oils |
3.04 |
3.42 |
3.60 |
5.41 |
3.38 |
2.40 |
1.64 |
| Beverages, Tobacco & Tobacco Product |
1.76 |
7.14 |
6.36 |
7.23 |
4.23 |
2.91 |
2.13 |
| Cotton Textiles |
2.61 |
-0.25 |
-0.44 |
-0.44 |
-1.20 |
-1.27 |
-2.14 |
| Man Made Textiles |
2.21 |
-4.11 |
-3.88 |
-2.79 |
-2.64 |
-2.34 |
-2.72 |
| Wood & Wood Products |
0.59 |
-0.05 |
0.25 |
2.97 |
3.85 |
3.80 |
3.49 |
| Paper & Paper Products |
2.03 |
1.70 |
1.37 |
1.37 |
1.90 |
2.64 |
2.78 |
| Leather & Leather Products |
0.84 |
0.76 |
1.11 |
2.31 |
2.46 |
2.96 |
1.75 |
| Rubber & Plastic Products |
2.99 |
-2.34 |
-2.08 |
-1.75 |
-2.02 |
-1.89 |
-2.15 |
| Chemicals & Chemical Products |
12.02 |
-0.40 |
-0.79 |
-0.66 |
-0.86 |
-0.73 |
-1.32 |
| Non-Metallic Mineral Products |
2.56 |
0.51 |
1.48 |
0.17 |
-0.17 |
0.62 |
1.83 |
| Cement & Lime |
1.39 |
0.63 |
1.80 |
0.11 |
-1.13 |
-0.92 |
1.05 |
| Basic Metals Alloys & Metal Product |
10.75 |
-3.02 |
-3.31 |
-4.46 |
-5.25 |
-7.89 |
-9.30 |
| Iron & Semis |
1.56 |
-7.00 |
-6.50 |
-8.53 |
-8.46 |
-12.82 |
-13.46 |
| Machinery & Machine Tools |
8.93 |
0.07 |
0.37 |
0.52 |
0.07 |
-0.15 |
-0.44 |
| Transport Equipment & Parts |
5.21 |
1.23 |
1.16 |
1.38 |
1.24 |
1.39 |
1.46 |