- News |
-
- Featured
-
Canada’s privacy commissioner launches investigation over the use..
As the years pass by, technology also widens, and more and more are being discovered. From simple gadgets..
- Business |
-
- Featured
-
Be an informer to I-T dept; earn up..
Sharing "specific information" with the income tax department about any benami..
- Tech & Industry |
-
- Featured
-
Gravitational wave event likely signaled birth of black..
The merger of two neutron stars that generated gravitational waves detected last year may have led to the birth..

- Entertainment |
-
- Topics
- Malayalam Film
- Media
- Music
- Youth
-
- Featured
-
Shawn Mendes Released Highly Anticipated Self-Titled Album Today
Los Angeles, CA : Multi-Platinum singer/songwriter Shawn Mendes released his highly anticipated self-titled third album today, via Island Records. Get..

-
- New Products |
-
- Topics
- General
-
- Featured
-
ZOTAC Introduces Its GeForce GTX 960 series graphics..
Dubai- ZOTAC International, a leading innovator and manufacturer of graphic cards and mini-

-
- Education |
-
- Topics
- Campus News
-
- Featured
-
ITM University, Gurgaon Student Palash Chhabra Represents Varsity..
New Delhi: Palash Chhabra, a student of ITM University,..

-
- Health |
-
- Topics
- Medical News
-
- Featured
-
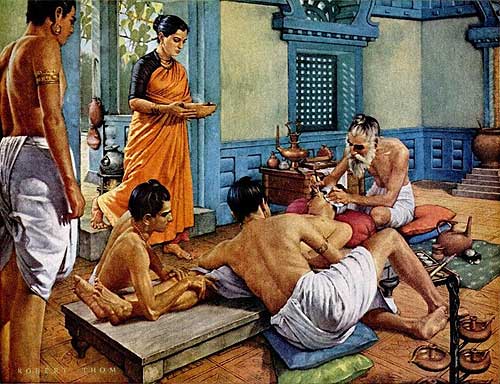
Maharshi Shushruta, The Great Grandfather of Surgery!
by Ayurvedacharya Dr.Hitesh Jani Dr.Hitesh Jani
-
- Tourism |
-
- Topics
- Travel
- Food&Beverages
- Hospitality
-
- Featured
-
“Keraliya Ayurveda is Credible and Authentic”
Irina Gurjeva Irina Gurjeva is not just another vacationer in..

-
- Sports |
- Editor's column |
- Magazine |
Paytm Quarter and Half Year ended September 30, 2021 Results – Revenue from Operations grew 64% Y-o-Y to ₹10.9 billion in Q2 FY 2022
Published on November 28, 2021
Mumbai: One 97 Communications Limited (referred to as “Paytm” or the “Company” hereon), today announced its financial results for the quarter and half year ended September 30, 2021.
Revenue from Operations grew 64% Y-o-Y to ₹10.9 billion in Q2 FY 2022, driven by 52% growth in non-UPI payment volumes (GMV) and more than 3 times growth in Financial Services and Other revenue
Contribution profit grew to ₹2.6 billion in Q2 FY 2022, Y-o-Y increase of 592%. Contribution margin jumped to 24.0% of revenue from 5.7% the previous year
Key Updates for Q2 FY 2022
- Revenue from Operations grew 64% Y-o-Y to ₹10.9 billion in Q2 FY 2022, driven by 52% growth in non-UPI GMV
- Contribution profit of ₹2.6 billion in Q2 FY 2022, up 592% Y-o-Y due to monetisation of our large distribution base through high margin offerings such as lending, advertisements and commerce offerings
- Indirect expenses (excluding ESOPs) as a percentage of revenue reduced from 70% of revenues in Q2 FY 2021 to 63% of revenues in Q2 FY 2022
- Improved Adjusted EBITDA margin to (39%) of revenues in Q2 FY 2022 (₹4,255 million), from (64%) of revenues Q2 FY 2021 (₹4,267 million), along with increased investments in technology and merchant base expansion
- Gross payment volume to merchant on Paytm platform (GMV) grew 107% Y-o-Y to ₹1,956 billion in Q2 FY 2022
Financial and Business Updates for Q2 FY 2022
Increased Revenue from Operations led by strong business fundamentals:
Our consolidated Revenue from Operations grew by 64% Y-o-Y to ₹10,864 million in Q2 FY 2022. Revenue from Payments and Financial Services grew 69% Y-o-Y to ₹8,426 million while Commerce and Cloud Services revenue grew by 47% Y-o-Y to 2,438 million.
Large increase in Contribution Profit:
Our contribution profit increased to ₹2.6 billion, up 592% Y-o-Y. Contribution profit for H1 FY 2022 at INR 5.0 billion has exceeded the contribution profit of INR 3.6 billion for the full previous financial year.
Payment processing charges continue to decline as a % of GMV from 0.52% in Q2 FY 2021 to 0.34% in Q2 FY 2022.
Revenues from Payment and Financial Services went up by 69% y-o-y to ₹8,426 million, driven by 52% growth in non-UPI payment volumes (GMV) and growth from Financial Services and Other revenues by more than 3 times
Revenue from Payment Services to Customers was up 54% Y-o-Y to ₹3,536 million, driven by increase in non-UPI payment usage on our consumer platform.
Revenue from Payment Services to Merchants was up 64% Y-o-Y to ₹4,003 million (run-rate of greater than $200 million) driven by non-UPI payment volume growth in payment gateway and growth in devices.
Financial Services and Others revenue grew 250% Y-o-Y to ₹887 million in Q2 FY 2022, driven by growth in Lending and Wealth (Paytm Money) revenues. The share of Financial Services and Others revenue increased from 3.8% of total revenue from operations in Q2 FY 2021 to 8.2% in Q2 FY 2022.
Revenues from Commerce and Cloud services went up by 47% Y-o-Y to ₹2,438 million
Revenue from commerce at ₹838 million up 69% Y-o-Y with continued post-covid recovery in travel and entertainment ticketing businesses.
Revenue from Cloud increased to ₹1,600 million up 37% Y-o-Y primarily due to a strong growth in the advertisement revenue.
Indirect Expenses reduced from 70% of revenues in Q2 FY 2021 to 63% of revenues in Q2 FY 2022
Marketing and promotional expenses (excluding cashback and incentives) at ₹1,023 million, unchanged at 9% of revenues Y-o-Y, even as we have increased Average MTUs by 14.4 million from Q2 FY 2021 to Q2 FY 2022. With continued investments in technology and merchant base expansion, our employee cost (excluding ESOP) at ₹3,672 million reduced from 40% of revenues in Q2 FY 2021 to 34% in Q2 FY 2022.
Improved Adjusted EBITDA margin to (39%) of revenues in Q2 FY 2022 (₹4,255 million), from (64%) of revenues Q2 FY 2021 (₹4,267 million), along with increased investments in technology and merchant base expansion
Adjusted EBITDA loss for the Q2 of FY 2022 was ₹4,255 million as compared to ₹4,267 million in Q2 FY 2021, as we continued investments in technology and merchant base expansion
We are well funded with Pro Forma Cash, Cash Equivalent and investable balance of ₹110 billion (₹ 29 billion as of September 2021 and ₹81 billion of net IPO proceeds) and have a large cushion of ungranted ESOPs.
Key Trends noted by management
Trends in our Businesses
- Growth of Payments revenues and profitability due to growth of payment volumes from non-UPI instruments (including Paytm Payment Instruments) and payment services to merchants
- Recovery of high-margin commerce business, and growth of Cloud due to ramp up of advertising
- Increase of Financial Services revenues driven by huge ramp up in Lending
Operating and Financial Performance Trends
- Efficiently increase users, merchants and GMV
- Strong momentum in revenue growth to continue; 64% growth y-o-y in Q2 FY 2022
- Step Jump in Contribution Margin achieved, with clear trends towards continued y-o-y improvements
- Indirect Expenses as a % of Revenues is going down
Operational Updates for Q2 FY 2022
Gross Merchandise Value (GMV) growth led by active user engagement & adoption across businesses. The company’s GMV for Q2 FY 2022 was ₹1,956 billion, up by 107% Y-o-Y and the growth momentum continued in October 2021, where the GMV at ₹832 billion was up 131% Y-o-Y.
Robust growth in number of customers: as we continue to invest in expanding our user base, the average Monthly Transacting Users (“MTU”) in Q2 FY 2022 is up by 33% Y-o-Y to 57.4 million and the trajectory has continued in October 2021 with 63 million MTUs, growth of 35% Y-o-Y compared to 47 million MTUs in October 2020.
The Monthly GMV per Transacting User for Q2 FY 2022 grew 55% Y-o-Y to ₹11,369
More merchants are using Paytm’s offerings: The number of merchant partners in our ecosystem continues to grow and the registered merchant base increased to 23 million in Q2 FY 2022, up from
18.5 million in Q2 FY 2021. The increase comes from adoption of our offline payment offerings (Paytm All-in-One QR code, Paytm All-in-One PoS, Paytm Soundbox that support multiple payment methods)
Widespread distribution of Paytm Devices: The devices deployed base grew to 1.3 million in Q2 FY 2022 from 0.3 million as of Q2 FY 2021. We continue to witness strong adoption of our devices amongst merchant partners as our deployed base further increased to approximately 1.4 million as of October 2021.
Rapid growth in lending business: The number of loans disbursed grew 714% Y-o-Y to over 2.8 million in Q2 FY 2022. The lending business continued to show strong growth as a result of the rapid scale-up of all of our lending products, including Postpaid (Buy-Now-Pay-Later), consumer loans and merchant loans. Our financial institution partners disbursed around 1.3 million loans in October 2021, a 472% increase in numbers of loans disbursed Y-o-Y and aggregating to a total disbursal of ₹6,270 million implying a 418% increase in value of loans disbursed Y-o-Y.
Note from the management
“The growth of non-UPI GMV has driven continued payments revenue growth, and our UPI-led payment volume growth is translating to a significant ramp up of our financial services offering. We are driving digital payments and financial services penetration and widespread adoption across India. Paytm has seen a strong second quarter of FY22, which is a testimony to the strong two-sided ecosystem of consumers and merchants that we have built. We have maintained the growth momentum in our payments services business, expanded our financial services business aggressively and are on our way to pre-COVID volumes for Commerce and Cloud services.”
Summary of Consolidated Financial Performance for Q2 FY 2022
| Particulars (in INR Millions) | Quarter Ended | Half Year ended | ||||||
| Sep-21 (Unaudited) | Sep-20 (Unaudited) | Y-o-Y | Jun-21 (Audited) | Q-o-Q | Sep-21 (Unaudited) | Sep-20 (Unaudited) | Y-o-Y | |
| Payments & Financial Services | 8,426 | 4,978 | 69% | 6,894 | 22% | 15,320 | 9,276 | 65% |
| Payment Services to Consumers | 3,536 | 2,290 | 54% | 3,005 | 18% | 6,541 | 4,375 | 50% |
| Payment Services to Merchants | 4,003 | 2,435 | 64% | 3,340 | 20% | 7,343 | 4,414 | 60% |
| Financial Services and Others | 887 | 253 | 250% | 549 | 62% | 1,436 | 487 | 195% |
| Commerce & Cloud Services | 2,438 | 1,661 | 47% | 2,014 | 21% | 4,452 | 2,875 | 55% |
| Commerce | 838 | 497 | 69% | 517 | 62% | 1,355 | 763 | 78% |
| Cloud | 1,600 | 1,164 | 37% | 1,497 | 7% | 3,097 | 2,112 | 47% |
| Revenue from Operations | 10,864 | 6,639 | 64% | 8,908 | 22% | 19,772 | 12,151 | 63% |
| Payment processing charges | 6,700 | 4,924 | 36% | 5,265 | 27% | 11,965 | 8,904 | 34% |
| As % of GMV | 0.34% | 0.52% | (18 bps) | 0.36% | (2 bps) | 0.35% | 0.54% | (19 bps) | |
| Promotional cashback & incentives | 833 | 742 | 12% | 607 | 37% | 1,440 | 1,057 | 36% | |
| Other Expenses | 724 | 597 | 21% | 591 | 23% | 1,315 | 994 | 32% | |
| Total Direct Expenses | 8,257 | 6,263 | 32% | 6,463 | 28% | 14,720 | 10,955 | 34% |