- News |
-
- Featured
-
Canada’s privacy commissioner launches investigation over the use..
As the years pass by, technology also widens, and more and more are being discovered. From simple gadgets..
- Business |
-
- Featured
-
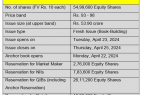
Be an informer to I-T dept; earn up..
Sharing "specific information" with the income tax department about any benami..
- Tech & Industry |
-
- Featured
-
Gravitational wave event likely signaled birth of black..
The merger of two neutron stars that generated gravitational waves detected last year may have led to the birth..

- Entertainment |
-
- Topics
- Malayalam Film
- Media
- Music
- Youth
-
- Featured
-
Shawn Mendes Released Highly Anticipated Self-Titled Album Today
Los Angeles, CA : Multi-Platinum singer/songwriter Shawn Mendes released his highly anticipated self-titled third album today, via Island Records. Get..

-
- New Products |
-
- Topics
- General
-
- Featured
-
ZOTAC Introduces Its GeForce GTX 960 series graphics..
Dubai- ZOTAC International, a leading innovator and manufacturer of graphic cards and mini-

-
- Education |
-
- Topics
- Campus News
-
- Featured
-
ITM University, Gurgaon Student Palash Chhabra Represents Varsity..
New Delhi: Palash Chhabra, a student of ITM University,..

-
- Health |
-
- Topics
- Medical News
-
- Featured
-
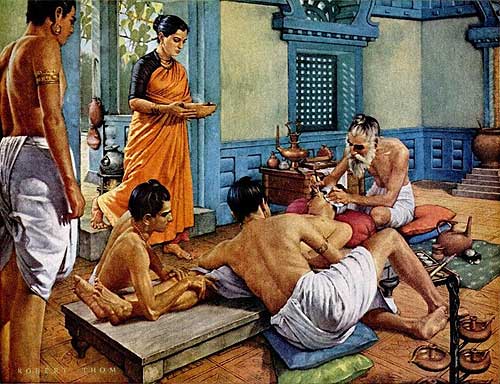
Maharshi Shushruta, The Great Grandfather of Surgery!
by Ayurvedacharya Dr.Hitesh Jani Dr.Hitesh Jani
-
- Tourism |
-
- Topics
- Travel
- Food&Beverages
- Hospitality
-
- Featured
-
“Keraliya Ayurveda is Credible and Authentic”
Irina Gurjeva Irina Gurjeva is not just another vacationer in..
-
- Sports |
- Editor's column |
- Magazine |
Advent International to Acquire Controlling Stake in Avra Laboratories From Dr A V Rama Rao & Family
SBI Card Q3 FY22 PAT Grows 84% to ₹386 Cr Vs ₹210 Cr for Q3 FY21
Published on January 25, 2022
- Cards in force cross the 13 Mn+ milestone
- New Accounts cross 1 Mn+ milestone in Q3 FY22
Kolkata: The Board of Directors of SBI Cards and Payment Services Limited approved the Company’s results for the quarter and 9 months ended December 31, 2021, at their meeting held on Monday, January 24, 2022.
Performance Highlights Q3 FY22
- Total Revenue increases 24% YoY to ₹3,140 Cr
- Profit after tax increases 84% YoY to ₹386 Cr
- ROAA at 5.0% for Q3 FY22 vs. 3.3% for Q3 FY21
- ROAE at 21.2% for Q3 FY22 vs. 13.8% for Q3 FY21
- Capital Adequacy Ratio at 24.2%; Tier 1 at 21.3%
Key Metrics
- New accounts volume at 1,008k for Q3 FY22 up by 10% as compared to 918k for Q3 FY21.
- Card-in-force grew by 15% to 1.32 Cr as of Q3 FY22 vs 1.15 Cr as of Q3 FY21.
- Total spends grew by 47% to ₹ 55,397 Cr in Q3 FY22 vs ₹ 37,797 Cr in Q3 FY21.
- Market share 9M FY22 (available till Nov’21) – Card-in-force at 19.2% (FY21: 19.1%); Spends at 19.0% (FY21: 19.4%); Transactions at 20.0% (FY21: 19.7%).
- Receivables grew by 13% to ₹ 29,129 Cr as of Q3 FY22 vs ₹ 25,749 Cr as of Q3 FY21.
- GNPA at 2.40% as of Q3 FY22 vs 4.51%* as of Q3 FY21; NNPA at 0.83% as of Q3 FY22 vs 1.60%* as of Q3 FY21.
- Total RBI RE book including RBI RE 2.0 assets at 2% in Q3 FY22 vs 9% in Q3 FY21.
Profit & Loss Account for the Quarter ended December 31, 2021
- Total revenue increased by ₹ 600 Cr, or 24% to ₹ 3,140 Cr for Q3 FY22 vs ₹ 2,540 Cr for Q3 FY21, increase is primarily due to higher Income from fees and services in Q3 FY22.
- Finance costs increased by ₹ 16 Cr, or 6% to ₹ 277 Cr for Q3 FY22 from ₹ 261 Cr for Q3 FY21.
- Total Operating cost increased by ₹ 371 Cr, or 28% to ₹ 1,719 Cr for Q3 FY22 from ₹ 1,348 Cr for Q3 FY21, increase is due to higher business volumes & festive campaigns in Q3 FY22.
- Earnings before credit costs increased by ₹ 213 Cr, or 23% to ₹ 1,144 Cr for Q3 FY22 vs ₹ 931 Cr for Q3 FY21.
- Total Management overlay provision at ₹ 162 Cr as on Dec’21. Impairment losses & bad debts expenses for Q3 FY22 at ₹ 625 Cr vs ₹ 648 Cr for Q3 FY21.
- Profit before tax increased by ₹ 236 Cr, or 83% to ₹ 519 Cr for Q3 FY22 vs ₹ 283 Cr for Q3 FY21
- Profit after tax increased by ₹ 176 Cr, or 84% to ₹ 386 Cr for Q3 FY22 vs ₹ 210 Cr for Q3 FY21
Profit & Loss Account for the 9 months ended December 31, 2021
For the 9 months ended December 31, 2021:
- Total revenue increased by ₹ 1,040 Cr, or 14% to ₹ 8,285 Cr for 9M FY22 vs ₹ 7,245 Cr for 9M FY21.
- Finance costs decreased by ₹ 40 Cr, or 5% to ₹ 760 Cr for 9M FY22 from ₹ 800 Cr for 9M FY21.
- Total Operating cost at ₹ 4,268 Cr for 9M FY22 from ₹ 3,361 Cr for 9M FY21, increase is primarily due to higher business volumes.
- Earnings before credit costs increased by ₹ 173 Cr, or 6% to ₹ 3,258 Cr for 9M FY22 from ₹ 3,085 Cr for 9M FY21.
- Impairment losses & bad debts expenses for the period at ₹ 1,865 Cr for 9M FY22 vs ₹ 1,995 Cr for 9M FY21.
- Profit before tax increased by ₹ 304 Cr, or 28% to ₹ 1,393 Cr for 9M FY22 vs ₹1,089 Cr for 9M FY21.
- Profit after tax increased by ₹ 226 Cr, or 28% to ₹ 1,035 Cr for 9M FY22 vs ₹ 809 Cr for 9M FY21.
Balance Sheet as of December 31, 2021
- Total Balance Sheet size as of December 31, 2021 was ₹ 32,105 Cr as against ₹ 27,006 Cr as of March 31, 2021.
- Total Gross Advances (Credit card receivables) as of December 31, 2021 were ₹ 29,129 Cr, as against ₹ 25,114 Cr as of March 31, 2021.
- Net worth as of December 31, 2021 was ₹ 7,468 Cr as against ₹ 6,374 Cr as of March 31, 2021.
Asset Quality
The Gross non-performing assets were at 2.40% of gross advances as on December 31, 2021 as against 4.51%* as on December 31, 2020. Net non-performing assets were at 0.83% as against 1.60%* as on December 31, 2020.
Capital Adequacy
As per the capital adequacy norms issued by the RBI, Company’s capital to risk ratio consisting of tier I and tier II capital should not be less than 15% of its aggregate risk weighted assets on – balance sheet and of risk adjusted value of off-balance sheet items. As of December 31, 2021, Company’s CRAR was 24.2% compared to 23.7% as of December 31, 2020.
The tier I capital in respect of an NBFC-ND-SI, at any point of time, is required to be not be less than 10%. Company’s Tier I capital was 21.3% as of December 31, 2021compared to 19.8% as of December 31, 2020.
Rating
CRISIL Long Term – AAA/Stable
CRISIL Short Term – A1+
ICRA Long Term – AAA/Stable
ICRA Short Term – A1+
Summary Profit and Loss Statement
| Rs Cr | Q3 FY21 | Q2 FY22 | Q3 FY22 | YoY | 9M FY21 | 9M FY22 | YoY |
| Interest Income | 1,173 | 1,173 | 1,273 | 9% | 3,864 | 3,600 | -7% |
| Others | 1,235 | 1,403 | 1,616 | 31% | 3,113 | 4,227 | 36% |
| Total Revenue from operations | 2,408 | 2,576 | 2,889 | 20% | 6,977 | 7,827 | 12% |
| Total Other Income | 131 | 119 | 250 | 90% | 268 | 458 | 71% |
| Total Income/Revenue | 2,540 | 2,695 | 3,140 | 24% | 7,245 | 8,285 | 14% |
| Finance costs | 261 | 254 | 277 | 6% | 800 | 760 | -5% |
| Operating Costs | 1,348 | 1,383 | 1,719 | 28% | 3,361 | 4,268 | 27% |
| Earnings before credit costs | 931 | 1,058 | 1,144 | 23% | 3,085 | 3,258 | 6% |
| Impairment losses & bad debts | 648 | 594 | 625 | -4% | 1,995 | 1,865 | -7% |
| Profit before tax | 283 | 464 | 519 | 83% | 1,089 | 1,393 | 28% |
| Profit after tax | 210 | 345 | 386 | 84% | 809 | 1,035 | 28% |
Summary Balance Sheet
| Rs Cr | Mar’21 | Dec’21 | Variance % |
| Assets | |||
| Loans (Net) | 23,459 | 27,969 | 19% |
| Cash & Bank Balances | 720 | 819 | 14% |
| Investments | 958 | 1,236 | 29% |
| Other Financial Assets | 269 | 279 | 3% |
| Total non-financial Assets | 1,600 | 1,803 | 13% |
| Total Assets | 27,006 | 32,105 | 19% |
| Liabilities and Equity | |||
| Total Equity | 6,302 | 7,396 | 17% |
| Borrowings | 17,895 | 21,049 | 18% |
| Other financial liabilities | 1,717 | 2,507 | 46% |
| Total non-financial liabilities | 1,092 | 1,151 | 5% |
| Total liabilities and equity | 27,006 | 32,105 | 19% |
* GNPA/NNPA for previous year on basis of proforma GNPA/NNPA.