- News |
-
- Featured
-
Canada’s privacy commissioner launches investigation over the use..
As the years pass by, technology also widens, and more and more are being discovered. From simple gadgets..
- Business |
-
- Featured
-
Be an informer to I-T dept; earn up..
Sharing "specific information" with the income tax department about any benami..

- Tech & Industry |
-
- Featured
-
Gravitational wave event likely signaled birth of black..
The merger of two neutron stars that generated gravitational waves detected last year may have led to the birth..

- Entertainment |
-
- Topics
- Malayalam Film
- Media
- Music
- Youth
-
- Featured
-
Shawn Mendes Released Highly Anticipated Self-Titled Album Today
Los Angeles, CA : Multi-Platinum singer/songwriter Shawn Mendes released his highly anticipated self-titled third album today, via Island Records. Get..

-
- New Products |
-
- Topics
- General
-
- Featured
-
ZOTAC Introduces Its GeForce GTX 960 series graphics..
Dubai- ZOTAC International, a leading innovator and manufacturer of graphic cards and mini-

-
- Education |
-
- Topics
- Campus News
-
- Featured
-
ITM University, Gurgaon Student Palash Chhabra Represents Varsity..
New Delhi: Palash Chhabra, a student of ITM University,..

-
- Health |
-
- Topics
- Medical News
-
- Featured
-
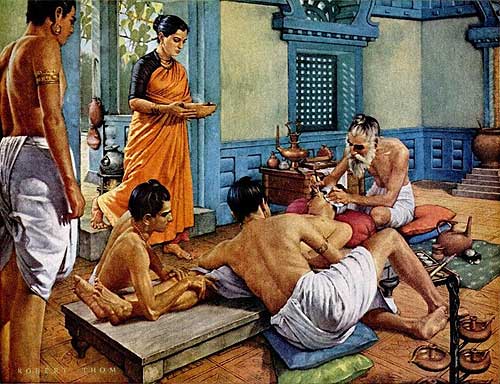
Maharshi Shushruta, The Great Grandfather of Surgery!
by Ayurvedacharya Dr.Hitesh Jani Dr.Hitesh Jani
-
- Tourism |
-
- Topics
- Travel
- Food&Beverages
- Hospitality
-
- Featured
-
“Keraliya Ayurveda is Credible and Authentic”
Irina Gurjeva Irina Gurjeva is not just another vacationer in..

-
- Sports |
- Editor's column |
- Magazine |
Market report from Mustafa Nadeem CEO ‘Epic Research’
Published on December 13, 2016
Nifty makes a Bullish hammer on daily chart suggesting a tug of war between bulls and bears.
Nifty ended above 8200 and paired yesterday losses and made a bullish hammer indicating short term bullish strength. A hammer is recognized by prevailing downtrend and small body is observed at the upper end of the trading range. The color of the candle is not important while the lower shadow is almost twice of the candle’s body.
It i a tug of war between bulls and bears and trading range as per channel on daily chart seems to be 8150 – 8350. As per OI data trading range also seems to be between a 150 – 200 points. Long addition is seen in 8300 & 8400 CE while liquidation in 8400 PE suggest upside resistance for bulls.
Sell on rise should be the strategy used for coming sessions.