- News |
-
- Featured
-
Canada’s privacy commissioner launches investigation over the use..
As the years pass by, technology also widens, and more and more are being discovered. From simple gadgets..
- Business |
-
- Featured
-
Be an informer to I-T dept; earn up..
Sharing "specific information" with the income tax department about any benami..
- Tech & Industry |
-
- Featured
-
Gravitational wave event likely signaled birth of black..
The merger of two neutron stars that generated gravitational waves detected last year may have led to the birth..

- Entertainment |
-
- Topics
- Malayalam Film
- Media
- Music
- Youth
-
- Featured
-
Shawn Mendes Released Highly Anticipated Self-Titled Album Today
Los Angeles, CA : Multi-Platinum singer/songwriter Shawn Mendes released his highly anticipated self-titled third album today, via Island Records. Get..

-
- New Products |
-
- Topics
- General
-
- Featured
-
ZOTAC Introduces Its GeForce GTX 960 series graphics..
Dubai- ZOTAC International, a leading innovator and manufacturer of graphic cards and mini-

-
- Education |
-
- Topics
- Campus News
-
- Featured
-
ITM University, Gurgaon Student Palash Chhabra Represents Varsity..
New Delhi: Palash Chhabra, a student of ITM University,..

-
- Health |
-
- Topics
- Medical News
-
- Featured
-
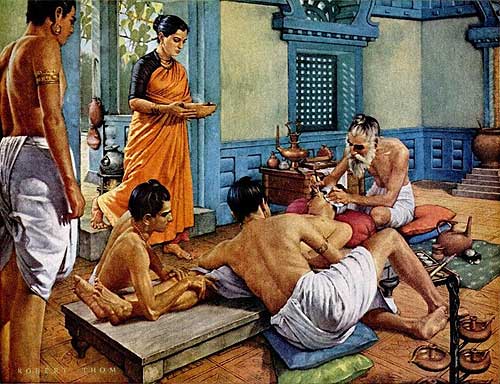
Maharshi Shushruta, The Great Grandfather of Surgery!
by Ayurvedacharya Dr.Hitesh Jani Dr.Hitesh Jani
-
- Tourism |
-
- Topics
- Travel
- Food&Beverages
- Hospitality
-
- Featured
-
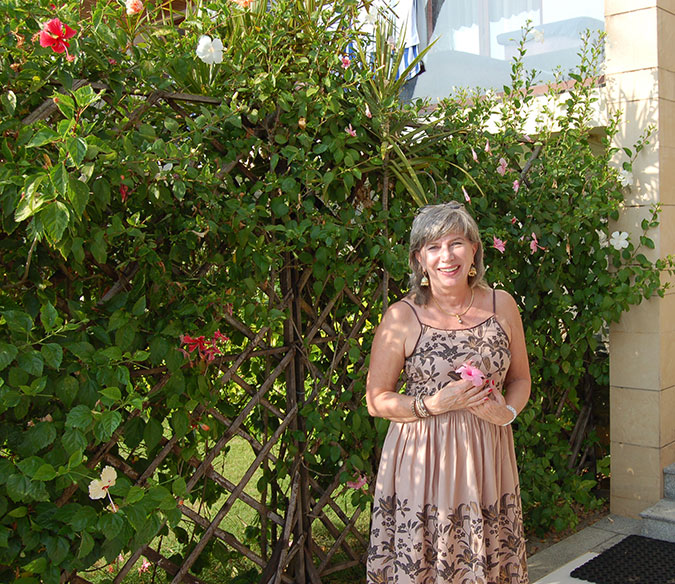
“Keraliya Ayurveda is Credible and Authentic”
Irina Gurjeva Irina Gurjeva is not just another vacationer in..
-
- Sports |
- Editor's column |
- Magazine |
Artprice launches technical analysis of the Art Market using Japanese candlestick charts
Published on November 11, 2014
France : Following the launch of its new art market indices, Artprice has begun modelling and representing the art market via a technique commonly used on financial markets: Japanese  candlestick charts.
But first a little history: Japanese candlestick charts take their name from a system whose origin dates back to the 17th century. Traditionally used to represent changes in rice prices, it is the oldest known form of graphical analysis allowing a simple and intuitive representation of price variations. Not only do the method’s graphics provide an easy visualization of market trends (growth, stability, trend reversals, etc.) they also, most importantly, indicate or suggest the direction of future movements.
This project would not have been possible without Artprice’s databases containing highly exhaustive information on international auction results over more than 15 years. The candlesticks technique of stock market analysis could not be applied to the Art Market without this wealth of accumulated data.
Artprice has conducted painstaking research to validate this highly original concept. A candlestick representation of the evolution of the art market does indeed point to a number of changes that are perfectly consistent with major events (both exogenous and endogenous to the Art Market).
Artprice also found a surprising level of correspondence between the graphics and subsequent reality when studying specific periods or when using the technique for specific artistic mediums, and even for the price evolutions of individual artists in recent years.