- News |
-
- Featured
-
Canada’s privacy commissioner launches investigation over the use..
As the years pass by, technology also widens, and more and more are being discovered. From simple gadgets..
- Business |
-
- Featured
-
Be an informer to I-T dept; earn up..
Sharing "specific information" with the income tax department about any benami..
- Tech & Industry |
-
- Featured
-
Gravitational wave event likely signaled birth of black..
The merger of two neutron stars that generated gravitational waves detected last year may have led to the birth..

- Entertainment |
-
- Topics
- Malayalam Film
- Media
- Music
- Youth
-
- Featured
-
Shawn Mendes Released Highly Anticipated Self-Titled Album Today
Los Angeles, CA : Multi-Platinum singer/songwriter Shawn Mendes released his highly anticipated self-titled third album today, via Island Records. Get..

-
- New Products |
-
- Topics
- General
-
- Featured
-
ZOTAC Introduces Its GeForce GTX 960 series graphics..
Dubai- ZOTAC International, a leading innovator and manufacturer of graphic cards and mini-

-
- Education |
-
- Topics
- Campus News
-
- Featured
-
ITM University, Gurgaon Student Palash Chhabra Represents Varsity..
New Delhi: Palash Chhabra, a student of ITM University,..

-
- Health |
-
- Topics
- Medical News
-
- Featured
-
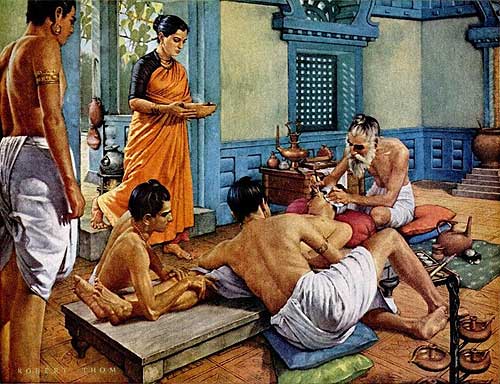
Maharshi Shushruta, The Great Grandfather of Surgery!
by Ayurvedacharya Dr.Hitesh Jani Dr.Hitesh Jani
-
- Tourism |
-
- Topics
- Travel
- Food&Beverages
- Hospitality
-
- Featured
-
“Keraliya Ayurveda is Credible and Authentic”
Irina Gurjeva Irina Gurjeva is not just another vacationer in..

-
- Sports |
- Editor's column |
- Magazine |
Cashfree Payments aims to double employee strength in 2022 for next phase of business growth
VerSe Innovation strengthens its leadership team with Sandip Basu’s appointment as Group CFO
FADA Releases December’21 Vehicle Retail Data
Published on January 5, 2022
- On YoY basis, total vehicle retails for the month of December’21 decreases by -16%. When compared to December’19 (a regular pre-covid month), overall retails continue to fall by -6%.
- On YoY basis, 3W and CV were up by 59% and 14%. 2W, PV and Tractors fell by -20%, -11% and -10% respectively.
- PV sales continue to face the brunt of semi-conductor shortage with consistent long waiting period
- 2W sales show no sign of recovery as customers continue to remain cautious with rising 3rd wave of Covid and bad rural sentiments.
- M&HCV segments continue healthy growth with low base of last year and bring CV sales at almost pre-covid levels.India once again starts facing the heat of Delta/Omicron wave with many states now starting to put movement restrictions thus which will further impact sales
New Delhi : The Federation of Automobile Dealers Associations (FADA) today released Vehicle Retail Data for December’21.
Commenting on how December’21 performed, FADA President, Mr. Vinkesh Gulati said, “The month of December is usually seen as a high sales month where OEMs continue to offer best discounts to clear the inventory due to change of year. It was however not the case this time around as retail sales continued to disappoint thus wrapping up an underperforming calendar year.
With semi-conductor shortage continuing to play spoil-sport, PV sales in spite of huge bookings, in December closed in red. Dealers however saw slight ease in vehicle supply thus giving some hope of improvement.
The 2W segment however was on a different trajectory when compared to PV. High cost of ownership, bad rural sentiment, work from home and the latest threat of omicron continued to impact sales.
CV segment continues to rise with M&HCV outshining LCV’s. The government’s push for infrastructure spending especially Road infrastructure, better freight rates, price hike announcement in Jan and a low base helped the overall segment close in positive double digits.”
Near Term Outlook
As mentioned in our last Press Release, India is once again under the grip of Covid with Delta/Omicron affecting people at an ultra-fast pace. This has also ignited the 3rd wave.
Various state governments have once again announced covid restrictions. Work and education from home have resumed and will have a negative effect for auto retail. With the fear of health care expenses rising again, the customers are shying away from closing their purchase decisions.
With IIT Kanpur predicting the peak of omicron sometimes in 1st week of February, FADA hence remains extremely cautious over the next 2-3 months.
Key Findings from our Online Members Survey
- Inventory at the end of December’21
Average inventory for Passenger Vehicles ranges from 8 – 10 days
Average inventory for Two – Wheelers ranges from 30 – 32 days
- Liquidity
Good = 45.1%
Neutral = 29.5%
Bad = 25.4%
- Sentiment
Good = 36.4%
Neutral = 32.9%
Bad = 30.6%
- Expectation in January
Flat = 39.3%
De-growth = 31.2%
Growth = 29.5%
Chart showing Vehicle Retail Data
| CATEGORY | DEC’21 | DEC’20 | YoY % | DEC’19 | % Chg, DEC’19 |
| 2W | 11,48,732 | 14,33,334 | -19.86% | 12,75,501 | -9.94% |
| 3W | 44,288 | 27,766 | 59.50% | 58,657 | -24.50% |
| PV | 2,44,639 | 2,74,605 | -10.91% | 2,18,881 | 11.77% |
| TRAC | 62,250 | 69,415 | -10.32% | 51,024 | 22.00% |
| CV | 58,847 | 51,749 | 13.72% | 59,517 | -1.13% |
| LCV | 36,047 | 34,167 | 5.50% | 38,268 | -5.80% |
| MCV | 4,099 | 2,499 | 64.03% | 3,014 | 36.00% |
| HCV | 16,066 | 11,278 | 42.45% | 15,385 | 4.43% |
| Others | 2,635 | 3,805 | -30.75% | 2,850 | -7.54% |
| Total | 15,58,756 | 18,56,869 | -16.05% | 16,63,580 | -6.30% |
Disclaimer:
- The above numbers do not have figures from AP, MP, LD & TS as they are not yet on Vahan 4.
- Vehicle Retail Data has been collated as on 03.01.22 in collaboration with Ministry of Road Transport & Highways, Government of India and has been gathered from 1,379 out of 1,590 RTOs.
- CV is subdivided in the following manner
- LCV – Light Commercial Vehicle (incl. Passenger & Goods Vehicle)
- MCV – Medium Commercial Vehicle (incl. Passenger & Goods Vehicle)
- HCV – Heavy Commercial Vehicle (incl. Passenger & Goods Vehicle)
- Others – Construction Equipment Vehicles and others