- News |
-
- Featured
-
Canada’s privacy commissioner launches investigation over the use..
As the years pass by, technology also widens, and more and more are being discovered. From simple gadgets..
- Business |
-
- Featured
-
Be an informer to I-T dept; earn up..
Sharing "specific information" with the income tax department about any benami..
- Tech & Industry |
-
- Featured
-
Gravitational wave event likely signaled birth of black..
The merger of two neutron stars that generated gravitational waves detected last year may have led to the birth..

- Entertainment |
-
- Topics
- Malayalam Film
- Media
- Music
- Youth
-
- Featured
-
Shawn Mendes Released Highly Anticipated Self-Titled Album Today
Los Angeles, CA : Multi-Platinum singer/songwriter Shawn Mendes released his highly anticipated self-titled third album today, via Island Records. Get..

-
- New Products |
-
- Topics
- General
-
- Featured
-
ZOTAC Introduces Its GeForce GTX 960 series graphics..
Dubai- ZOTAC International, a leading innovator and manufacturer of graphic cards and mini-

-
- Education |
-
- Topics
- Campus News
-
- Featured
-
ITM University, Gurgaon Student Palash Chhabra Represents Varsity..
New Delhi: Palash Chhabra, a student of ITM University,..

-
- Health |
-
- Topics
- Medical News
-
- Featured
-
Maharshi Shushruta, The Great Grandfather of Surgery!
by Ayurvedacharya Dr.Hitesh Jani Dr.Hitesh Jani

-
- Tourism |
-
- Topics
- Travel
- Food&Beverages
- Hospitality
-
- Featured
-
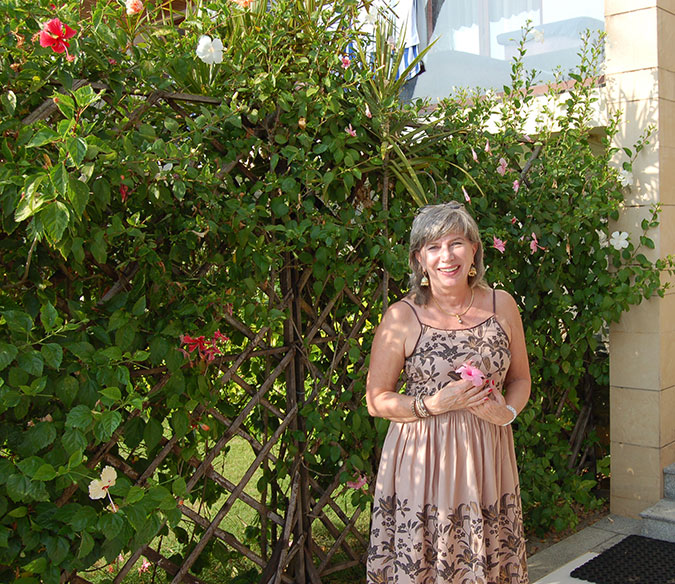
“Keraliya Ayurveda is Credible and Authentic”
Irina Gurjeva Irina Gurjeva is not just another vacationer in..
-
- Sports |
- Editor's column |
- Magazine |
Shri Jyotiraditya M. Scindia inaugurates first direct flight between Bhubaneswar – Jaipur
Sun Pharma reports Q2FY22 results
Published on November 2, 2021
Q2 Gross Sales at Rs. 95,567 million up 13% YoY
Q2 Net Profit at Rs. 20,470 million up 29% v/s Adjusted Net Profit of Q2FY21
Mumbai : Sun Pharmaceutical Industries Limited (Reuters: SUN.BO, Bloomberg: SUNP IN, NSE: SUNPHARMA, BSE: 524715) reported financials for the second quarter ending September 30th, 2021.
Highlights of Q2FY22 consolidated financials
· Consolidated sales from operations at Rs. 95,567 million, growth of 13% over Q2 last year
· India sales at Rs. 31,878 million, up 26% over same quarter last year
· US finished dosage sales at US$ 361 million, growth of 8% over Q2 last year
· Emerging Markets sales at US$ 243 million, up by 16% over Q2 last year
· Rest of World sales at US$ 188 million, up by 5% over same quarter last year
· R&D investments at Rs. 5,364 million compared to Rs. 6,127 million for Q2FY21
· EBITDA at Rs. 25,608 million, up by 21% over Q2 last year, with resulting EBITDA margin of 26.8%
· Net profit for the quarter was at Rs. 20,470 million, up 29% compared to adjusted net profit of Q2 last year and up 13% versus reported net profit YoY
Highlights of H1FY22 consolidated financials
- Consolidated sales from operations at Rs. 192,262 million, growth of 20% over same period last year.
- India sales at Rs. 64,961 million, up by 32% over H1 last year.
- US finished dosage sales at US$ 741 million up by 20% over H1 last year.
- Emerging Markets sales at US$ 461 million up by 20% over H1 last year.
- Rest of World sales at US$ 373 million, up by 18% over H1 last year.
- EBITDA at Rs. 53,325 million up 38% over H1 last year, with resulting EBITDA margin of 27.7%.
- Excluding the exceptional items, adjusted net profit for H1FY22 was at Rs. 40,263 million, up 47% YoY. Reported net profit for H1FY22 was at Rs. 34,912 million compared to Rs. 1,572 million for H1 last year.
These results were taken on record by the Board of Directors at a meeting held today.
Dilip Shanghvi, Managing Director of the Company said, “Following our good Q1 performance, we have sustained the positive momentum in Q2 with a topline growth of 13% YoY, driven by a broad-based growth across multiple geographies. Our global specialty business has grown by 43% over Q2 last year. Ilumya has grown both YoY and sequentially. Our India business continues to do well with a growth of 26% YoY. We remain steadfast in our focus on growing our overall business and simultaneously strengthening our global specialty portfolio. The recent launch of Winlevi in US and Ilumya in Canada is a step forward in this direction.”
Debt Repayment
The company has repaid debt of about US$ 209 million in H1FY22 compared to the debt as of March 31, 2021. With this debt repayment, Sun Pharma had a net cash of about US$ 200 million as of 30th September, 2021, on ex-Taro basis.
India Business – Market Leadership
Sale of branded formulations in India for Q2FY22 were at Rs. 31,878 million, up by 26% over Q2 last year and accounting for 33% of total sales. For the first half, sales were at 64,962 million, up by 32% over same period last year.
Sun Pharma is ranked No. 1 and has increased its market share to 8.1% in the Indian pharmaceutical market as per AIOCD AWACS MAT September-2021 report. For Q2FY22, the company launched 28 new products in the Indian market.
US Formulations (including Taro)
Sales in the US were US$ 361 million, a growth of 8% over Q2 last year and accounting for about 28% of total consolidated sales. For first half sales were US$ 741 million recording a growth of 20% over same period last year.
Taro Performance
Taro posted Q2FY22 sales of US$ 132 million, lower by about 8% YoY and adjusted net profit of about US$ 25 million, lower by 45% over Q2 last year. For the first half, sales were US$ 279 million, up by 7% over H1 last year. Excluding the impact from the settlement and loss contingencies charges in both periods, adjusted net profit for H1FY22 was US$ 66 million compared to US$ 74.2 million in H1FY21. Taro’s reported net profit for H1FY22 was US$ 4.5 million.
Emerging Markets
Our sales in Emerging Markets were at US$ 243 million for Q2, a growth of 16% over Q2 last year and accounting for about 19% of total consolidated sales for the quarter. For the first half, sales were US$ 461 million, up by 20% over first half last year.
Rest of World Markets
Formulation sales in Rest of World (ROW) markets, excluding US and Emerging Markets, were US$ 188 million in Q2FY22, up by about 5% over Q2 last year and accounting for approximately 15% of total consolidated sales. For the first half, sales were US$ 373 million, up by 18% over first half last year.
Active Pharmaceutical Ingredients (API): Strategic strength
For Q2FY22, external sales of API were at Rs. 4,358 million, lower by about 15% over Q2 last year; driven mainly by lower opiates sales. For the first half, API sales were at Rs. 9,507 million, down by about 11% over first half last year. Our API business imparts benefits of vertical integration and continuity of supply chain for our formulations business. We continue to focus on increasing API supplies for captive consumption relating to our key products.
Research – Investing for future
Consolidated R&D investment for Q2FY22 was Rs. 5,364 million as compared to Rs. 6,127 million for Q2 last year. The reduction is due to spill-over of certain clinical studies into subsequent quarters. For the first half, R&D expense was Rs. 11,290 million, or 5.9% of sales.
Our R&D efforts span across both specialty and generic businesses and we continue to invest in building the pipeline for various markets including the US, Emerging Markets, RoW Markets and for India. We have a comprehensive product offering in the US market consisting of approved ANDAs for 508 products while filings for 88 ANDAs await US FDA approval, including 20 tentative approvals. For the quarter, 3 approvals were received. Additionally, the portfolio includes 53 approved NDAs while 13 NDAs await US FDA approval.
| Sales and R&D | ||||||
| (` in Mn) | ||||||
| Particulars | Quarter ended | Half Year ended | Year ended | |||
| 30.09.2021 | 30.06.2021 | 30.09.2020 | 30.09.2021 | 30.09.2020 | 31.03.2021 | |
| India Formulations | 31,878.0 | 33,083.5 | 25,311.3 | 64,961.5 | 49,195.6 | 103,432.1 |
| US Formulations | 26,773.0 | 28,000.1 | 24,915.1 | 54,773.1 | 46,304.0 | 100,921.2 |
| Emerging Market | 18,005.4 | 16,052.6 | 15,587.8 | 34,058.0 | 28,751.9 | 57,839.7 |
| ROW Formulations | 13,926.0 | 13,680.0 | 13,362.8 | 27,606.0 | 23,796.7 | 48,955.8 |
| Total Formulations | 90,582.4 | 90,816.2 | 79,177.0 | 181,398.6 | 148,048.2 | 311,148.8 |
| Bulk | 4,358.4 | 5,148.9 | 5,104.4 | 9,507.3 | 10,641.8 | 19,503.5 |
| Others | 626.6 | 729.2 | 465.5 | 1,355.8 | 915.1 | 1,678.5 |
| Total Sales | 95,567.4 | 96,694.3 | 84,746.9 | 192,261.7 | 159,605.1 | 332,330.8 |
| Total R&D Expenditure | 5,364.1 | 5,926.0 | 6,127.3 | 11,290.1 | 10,333.3 | 21,499.4 |
| Capital | 200.4 | 177.9 | 152.7 | 378.3 | 206.8 | 471.2 |
| Revenue | 5,163.7 | 5,748.1 | 5,974.6 | 10,911.8 | 10,126.5 | 21,028.2 |
| Exchange Rates: $1 = ` | 74.09 | 73.75 | 74.37 |